Jake Rosenfeld is Associate Professor of Sociology at Washington University-St. Louis. He is the author of What Unions No Longer Do (Harvard University Press, 2014). For more on his work, see www.jakerosenfeld.net.
Patrick Denice is a postdoctoral researcher in the sociology department at Washington University in St. Louis. He received his Ph.D. in sociology from the University of Washington (Seattle) in 2016. His research examines stratification in education and the labor market.
A spate of labor-related election postmortems converged on one key theme: Donald Trump managed to cleave significant union support away from the Democrats. “Donald Trump Got Reagan-Like Support from Union Households,” ran one typical headline; “It Looks Like Donald Trump Did Really Well With Union Households,” declared another. But what if these prognoses have it wrong? Could it be that instead of Trump’s unique appeal to union household voters, the election results really suggest sagging enthusiasm among union households for the Democratic candidate?
It is true that the Democratic-Republican vote split among union households was narrower in 2016 than in any time since, well, Ronald Reagan’s re-election. In 2016, exit polls indicate that voters in union households supported the Democratic over the Republican candidate by only 8 points. In 2012, by contrast, the Democratic advantage among members of union households was a yawning 18 points. And 2016’s gap looks positively miniscule compared to the Democratic vote advantage among union households Bill Clinton enjoyed. In 1992, exit polls suggest that members of union households preferred Clinton to George H.W. Bush by over 30 points.
Below we display exit poll results from every presidential race dating back to Ronald Reagan’s defeat of Jimmy Carter in 1980.[1] The figure shows the Democratic candidate advantage over the Republican candidate in the union household vote. In Reagan’s first victory, there was hardly any Democratic advantage: In 1980, Reagan managed 45% of the union household vote, compared to 48% for Jimmy Carter (the rest went largely to the 3rd party candidate in that race, John Anderson).
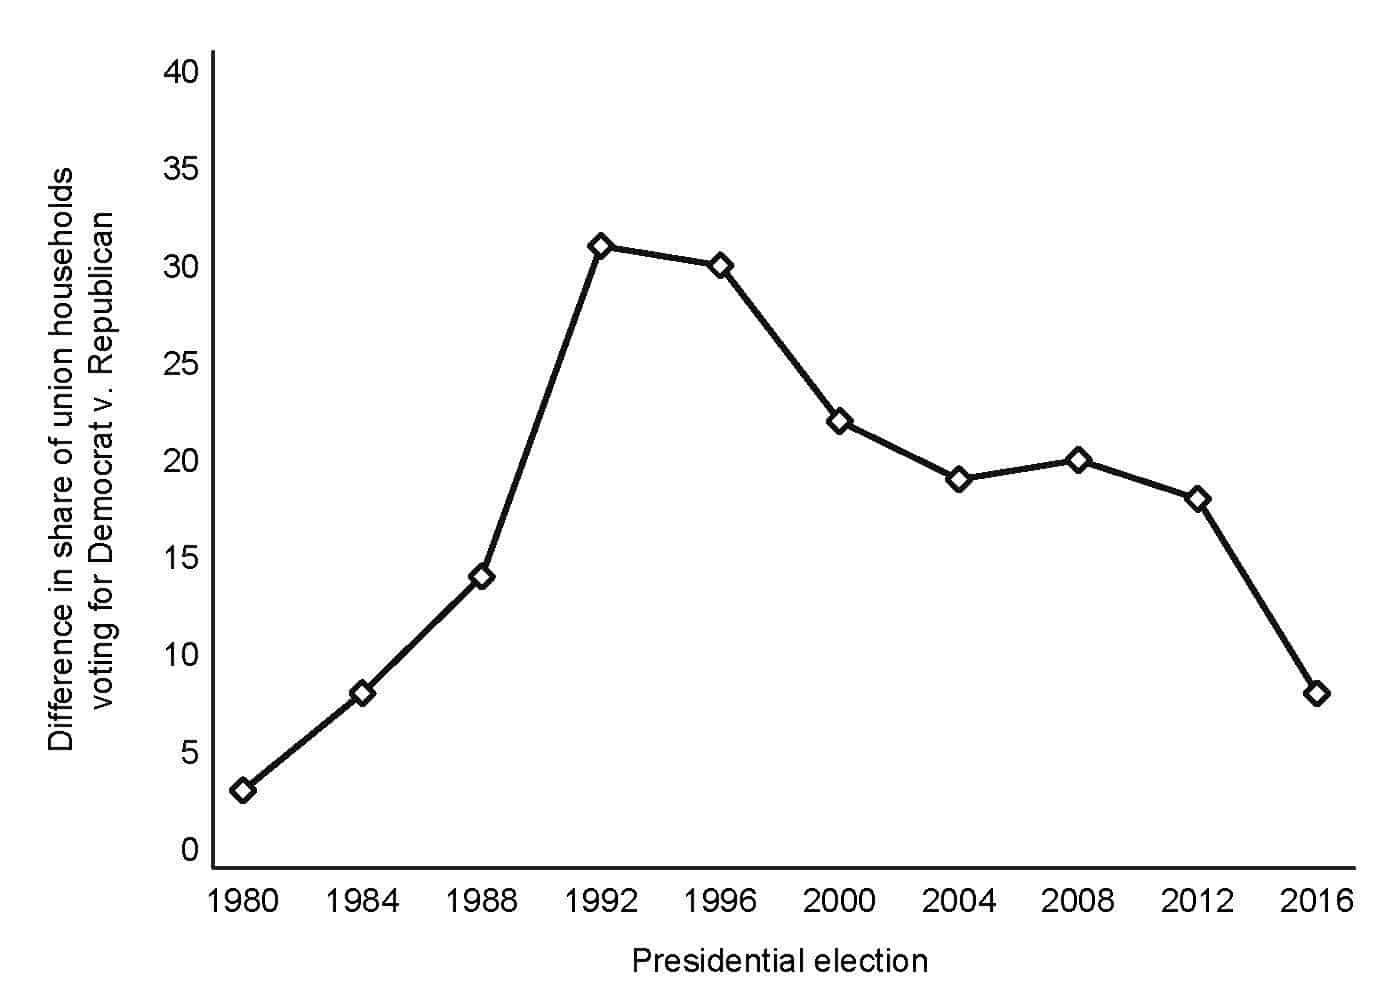
Based on this figure alone it sure appears that the postmortems have it right. In 2016 the partisan split among union households was smaller than at any time since Ronald Reagan’s re-election in 1984.
But there is another way of investigating the issue. What if the shrunken Democratic vote advantage among union households in 2016 didn’t so much stem from Trump’s inroads among union household members, but from union households turning to outsider candidates over the Democratic Party choice? The 2016 election featured not one but two candidates unaffiliated with the Democratic or Republican Party: Jill Stein and Gary Johnson – the Green Party and Libertarian Party candidates. Thus the widely-cited 8-point difference in the union household vote may not reflect Trump’s singular success in winning over voters in union households. It might instead stem from dampened enthusiasm among union household voters for Hillary Clinton, as exhibited by a rise in the union household vote for these unaffiliated candidates. To investigate this issue we examined the share of the union household vote going to the Republican candidate in every presidential race from 1980 onward. We display the results below.
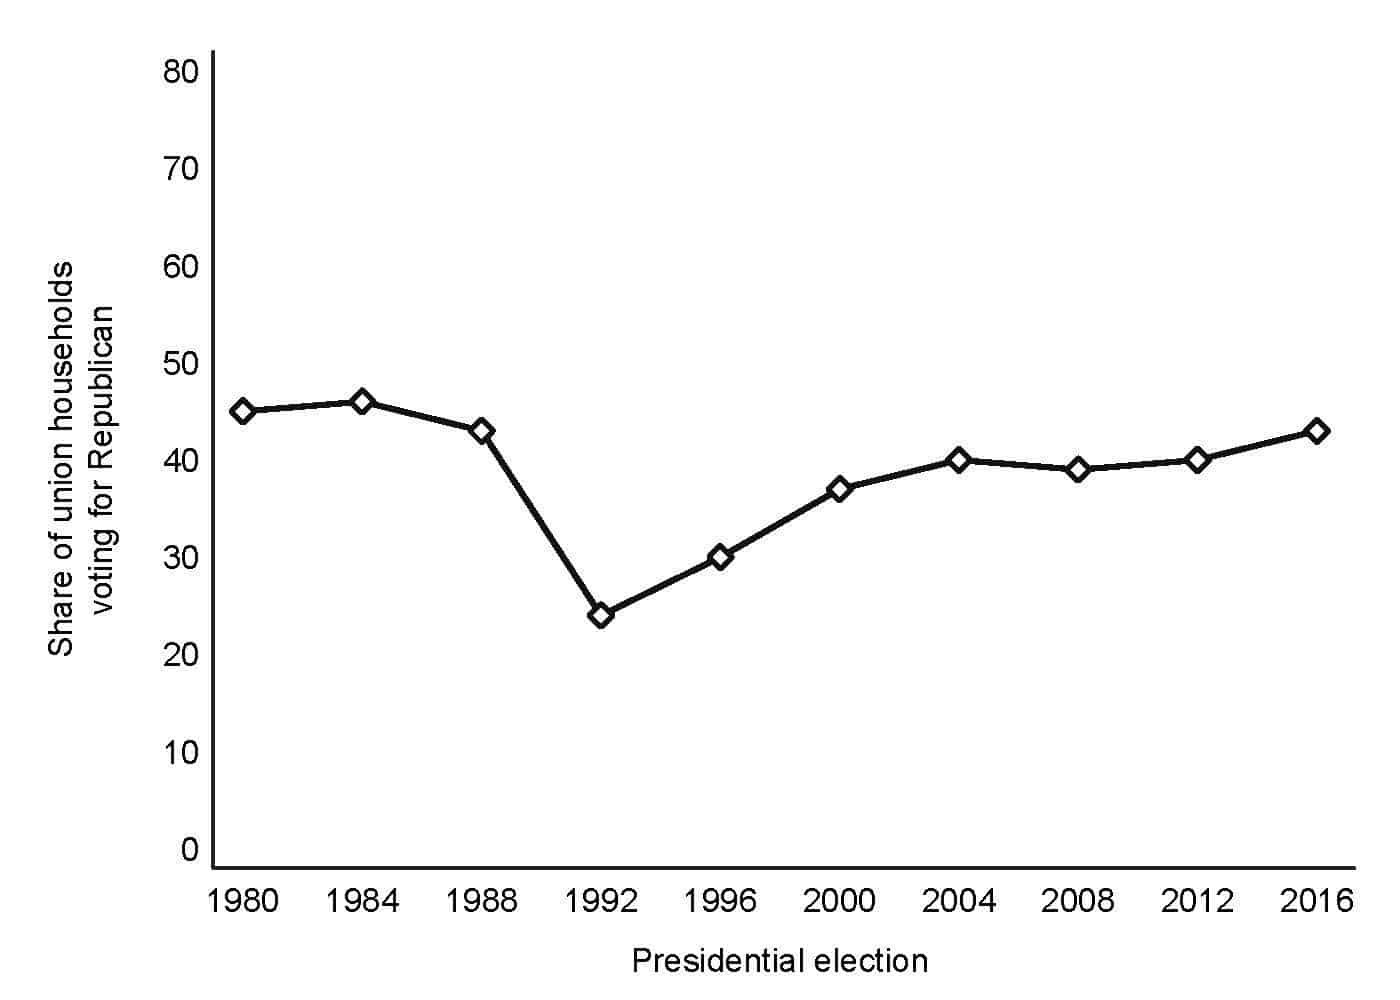
Here we see that Trump did outdo Mitt Romney’s performance among union household voters – but by only 3 points. Much more significantly, between 2012 and 2016 the share of the union household vote going to the Democrat in the race shrank from 58% to 51%, with the share of union household members saying that they voted for neither the Democrat nor the Republican in the race tripling, from 2% to 6%. What the figure above underscores is that, in fact, Trump performed pretty similarly to past Republican candidates among union households. The trend is pretty stable, with the dip in 1992 and 1996 due, once again, to the 3rd party candidate in the race, that time Ross Perot. In 1992, for example, Perot secured just over a fifth of the union household vote. Absent Perot, if most of his voters would have chosen the Republican in the race (and studies indicate that Perot took more votes from the Republican in that year’s race than the Democrat), then the Republican vote share among union households would have settled at just about 40%.
A few caveats to add to the discussion. First, exit polls are notoriously noisy, and alterations in how the questions about union households are worded mean that the long-term trends we display should be interpreted with caution, as Richard Freeman has highlighted. Second, the typical union household has changed over time. On the one hand, as union membership has declined, it’s likely that your typical union household contains fewer members, on average, than it did back in 1980, when the overall unionization rate was over twice as high as it is today. If true, the fact that the Republican share of the union household vote hasn’t risen all that appreciably is noteworthy. But countervailing that likely trend are changes in what your typical union member looks like today compared to decades past, as Richard Yeselson has recently noted. The union member of a union household in 2016 is much more likely to be a public school teacher than, say, an air conditioning manufacturing worker. Finally, while the data remain spotty, it does seem that Trump’s unconventional campaign won over union households in certain areas. In Ohio Trump actually outperformed Clinton among union household voters. Yet in another closely watched state, Michigan, Trump underperformed among union households compared to his national average.
Caveats aside, the evidence thus far cautions against making too much of Trump’s success at wooing union households. What these results do suggest is the need for Democrats going forward to craft a message and groom candidates that might reverse waning enthusiasm among this core constituency. Every four years, approximately 2 out of every 5 union household voters choose the Republican in the race. From this perspective, 2016 was quite typical. What was atypical was the drop-off in union household support for the Democrat in the race, and yet that decline has received nearly no attention by journalists and other interested parties.
[1] The data displayed in the figures comes from the exit polls results provided by the Roper Center for Public Opinion Research at Cornell University.
Jake Rosenfeld is Associate Professor of Sociology at Washington University-St. Louis and an OnLabor Senior Contributor. Patrick Denice is a postdoctoral researcher in the sociology department at Washington University in St. Louis. He received his Ph.D. in sociology from the University of Washington (Seattle) in 2016. His research examines stratification in education and the labor market.




Daily News & Commentary
Start your day with our roundup of the latest labor developments. See all
January 26
Unions mourn Alex Pretti, EEOC concentrates power, courts decide reach of EFAA.
January 25
Uber and Lyft face class actions against “women preference” matching, Virginia home healthcare workers push for a collective bargaining bill, and the NLRB launches a new intake protocol.
January 22
Hyundai’s labor union warns against the introduction of humanoid robots; Oregon and California trades unions take different paths to advocate for union jobs.
January 20
In today’s news and commentary, SEIU advocates for a wealth tax, the DOL gets a budget increase, and the NLRB struggles with its workforce. The SEIU United Healthcare Workers West is advancing a California ballot initiative to impose a one-time 5% tax on personal wealth above $1 billion, aiming to raise funds for the state’s […]
January 19
Department of Education pauses wage garnishment; Valero Energy announces layoffs; Labor Department wins back wages for healthcare workers.
January 18
Met Museum workers unionize; a new report reveals a $0.76 average tip for gig workers in NYC; and U.S. workers receive the smallest share of capital since 1947.